So what does this translate to?
Imagine that you are making a puzzle, and after finishing, you realize that the first piece was misplaced (Figure 1). Many forget, that the starting point for planning of Sourcing, Production, Capacity and Distribution to name a few, in many cases, is the sales forecast. Not to forget, the S&OP and Business plan.
The accumulated effect of placing the first piece wrong can have a significant impact on the Supply Chain performance, and weaken strategic initiatives such as “Cost reductions”, “Market Expansion” or “Market Penetration”.
A general conception is that forecasts don’t add much value, and often are downgraded. As a result, the stakeholders responsible for Demand Planning and Forecasting cut corners and apply a “one size fits all” approach to all SKUs/categories combined with gut feeling. This tendency stems from numerous cases of poor forecasts, promoting a predominance of gut feeling when making adjustments, that might lead to even worse results than in the first place. Demand Planning and Forecasting does not necessarily require several days of work or advanced statistical competences. In fact, many factors come into play, when determining the level of sophistication one should use when performing the latter.
This article will visit the roots of Demand Planning and Forecasting by emphasizing the importance and interdependency between the two. A simplified approach to streamline the Demand Planning and Forecast process will be introduced with a step by step review, reflecting best practice.
A prerequisite for relying on your forecast, besides a low forecast error, is to follow the same process again and again. You might change the input along the way and get different output, but you still adhere to the same steps.
W. Edwards Deming1 has been quoted in numerous works with the phrase:
“If you can’t describe what you are doing as a process, you don’t know what you’re doing.”
In relation, it is important to stress that companies should adhere to the suggested process, regardless of their maturity level. As a result, the level of sophistication in each of the 10 steps, will vary with the identified maturity.
Business Consulting’s (BC) maturity assessment combines 4 dimen-sions: Organization, Process, Content and Technology as illustrated in Figure 2.
In general, we consider the suggested process in Figure 3 as “Demand Planning”, whereas “Forecasting” covers step 1-5.
Before elaborating on the 10 steps, it should be underlined that the forecast horizon depends among other on product characteristics, competitive landscape and historical demand fluctuations. The forecast horizon, and the need to make adjustments varies a lot across industries and product categories. If a given industry or product category is characterized by perishable products and many promotional activities, a short planning fence would be required allowing manual adjustments close to “release”. This could for instance be cheese or other dairy products. In the other end of the spectrum, you will find screws, cables or timber characterized by a long shelf life and few promotions compared to dairy products.
We suggest 10 steps to streamline the demand planning and forecasting process (Figure 3).
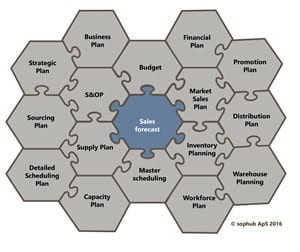
Figure 1: Sales forecast — the starting point of several plans.
1. Cleaning of sales history
- Data points that seem to disturb the effect we are trying to isolate (Outliers), e.g. shortages, significant changes in market conditions and/or promotions.
- Data points that seem errorprone, e.g. mistakes in aggregation level or during data collection.
- Produce a sales baseline reflecting the sales data for a product during its normal life cycle.
- As a rule of thumb, one should use 60-70% of the allocated time to ensure a solid data foundation. The forecast will not provide value, if the data quality is low/not properly cleansed!
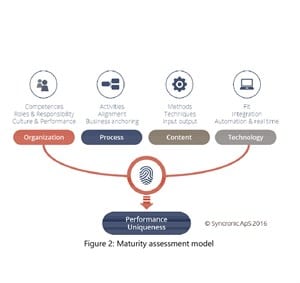
Figure 2: Maturity assessment model
2. Product segmentation
- Rearrange product portfolio into segments that have similar demand characteristics.
- Segmentation can be executed in many ways, e.g. a matrix combining ABC (Value) and/ or LMN (Volume) with XYZ (Variability).Define forecasting profiles for the segments, which will allow you to prioritize the categories/SKUs that need constant attention and those that are stable.
3. Statistical forecast
- Determine the segment’s level, trend and seasonality.
- Based on the company maturity, decide the level of sophistication of the forecast model. Most frequently used models include naïve forecast, moving average models, exponential smoothing, Holt’s, Winter’s and Croston’s.
- Make a fit between segmentation and forecast model.
4. Evaluate alerts
- After deciding the forecast model, consider if any alerts exist (Notification when the forecast error is outside a defined interval) and assess the level of tolerance.
- Methods to calculate forecast error include among other MAD, MSE and (s)MAPE.
- We suggest that you set alerts based on the chosen forecast error method. Some systems suggest alerts as a standard part of the process, whereas others require you to manually opt-in.
- Monitor fluctuations in forecast errors proactively.
5. Add campaigns/promotions
- Sales & Marketing add information about timing of promotions and events, and the expected impact on sales.
- Adding valuable information can increase the reliability of the forecast and mitigate big fluctuations in the supply chain.
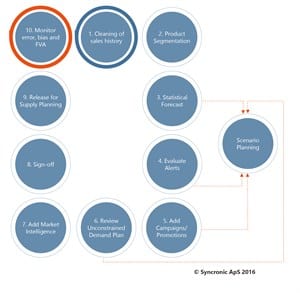
Figure 3: Demand Planning and Forecasting process.
6. Review unconstrained demand plan
- The unconstrained demand is the determined demand for the given products/services assuming there are no supply constraints.
- The quantity that Sales realistically projects it can sell.
7. Add market intelligence
- Information concerning the company’s external environment, e.g. new competitors, changes in regulatory and environmental laws, currency fluctuations and/or supply shortages.
- The forecast reflects the complete picture of the corporate expectations in a set of given market conditions.
8. Sign-off
- The consensus demand forecast is signed off by relevant stakeholders, e.g. demand planner, head of planning and functions providing input.
- The stakeholders that have “signed-off” are held accountable for the forecast.
9. Release for Supply Planning
- The consensus demand forecast is released.
- Supply constraints can now be assessed based on the demand input.
10. Monitor error, bias and FVA
- Assess the forecast error.
- Consider the number of involved stakeholders in the process, the higher the number, the more potential bias.
- In each cycle, consider the forecast value added (FVA) effect of the manual adjustments. Did the input from Sales & Marketing (step 5) and market intelligence (step 7) make the forecast outperform a naïve forecast? (Last period’s sales).
- Proactive adjustments of the sales forecast and incremental learning curve.
Scenario Planning
Scenarios force the stakeholders to reconsider their standard world view, exposing blind spots that might have been omitted in previous forecasts. “What-if” analyses can prevent unfortunate surprises.
One should always make scenarios based on the statistical forecast model, alerts and campaigns (Step 3-5) as reflected in Figure 3.
Decisionmakers are better able to recognize a scenario in its infancy, should a different scenario than the expected unfold.
Scenario Planning help to cancel-out the “gut feeling” approach and may reveal significant changes, that can impact the traditional forecast significantly.
So what does this translate to?
Gut feelings should be degraded and used as an input in the suggested process instead. Your forecast should be trusted, if, and only if a consistent process is defined including a rich data foundation.
When the latter is checked off, you will have a reliable starting point to base your plans on. This will enable you to obtain the desired benefits of the planned strategy such as cost reductions, customer satisfaction or higher service levels.
With reference to Figure 1, remember that plans are non-value adding if the starting point (Sales forecast) is based solely on gut feelings and not supported by a formalized process with a solid data foundation as the starting point.
1 American engineer, statistician, professor, author, and management consultant.